County Population Changes Since Census Day 2020

By law, the United States counts its residents every 10 years as of “census day,” April 1. But population changes happen between census days, and many data users — businesses, governments, academics, researchers — need timely counts. So the Census Bureau does many different kinds of population estimates between decennial censuses.
The Vintage Estimates is one of those estimation programs. It looks at births, deaths, and net migration (domestic and international) to determine whether population has increased or decreased in a particular time period. Estimates are done at the national, state, and county levels.
The decennial census in 2020 was the covid-19 census, with census day occurring only two months into the pandemic. Lockdowns and restrictions made conducting the census challenging, and the virus caused unique population changes in the following months. The latest Census Bureau release of population estimates looks at the changes that occurred in the 15 months after census day 2020, from April 1, 2020 to July 1, 2021.
The population of the U.S. increased during this time, but at the slowest rate in the nation’s history of counting its people.
“Population growth has been slowing for years because of lower birth rates and decreasing net international migration, all while mortality rates are rising due to the aging of the nation’s population,” said Kristie Wilder, a demographer in the Population Division at the Census Bureau. “Now, with the impact of the covid-19 pandemic, this combination has resulted in a historically slow pace of growth.”
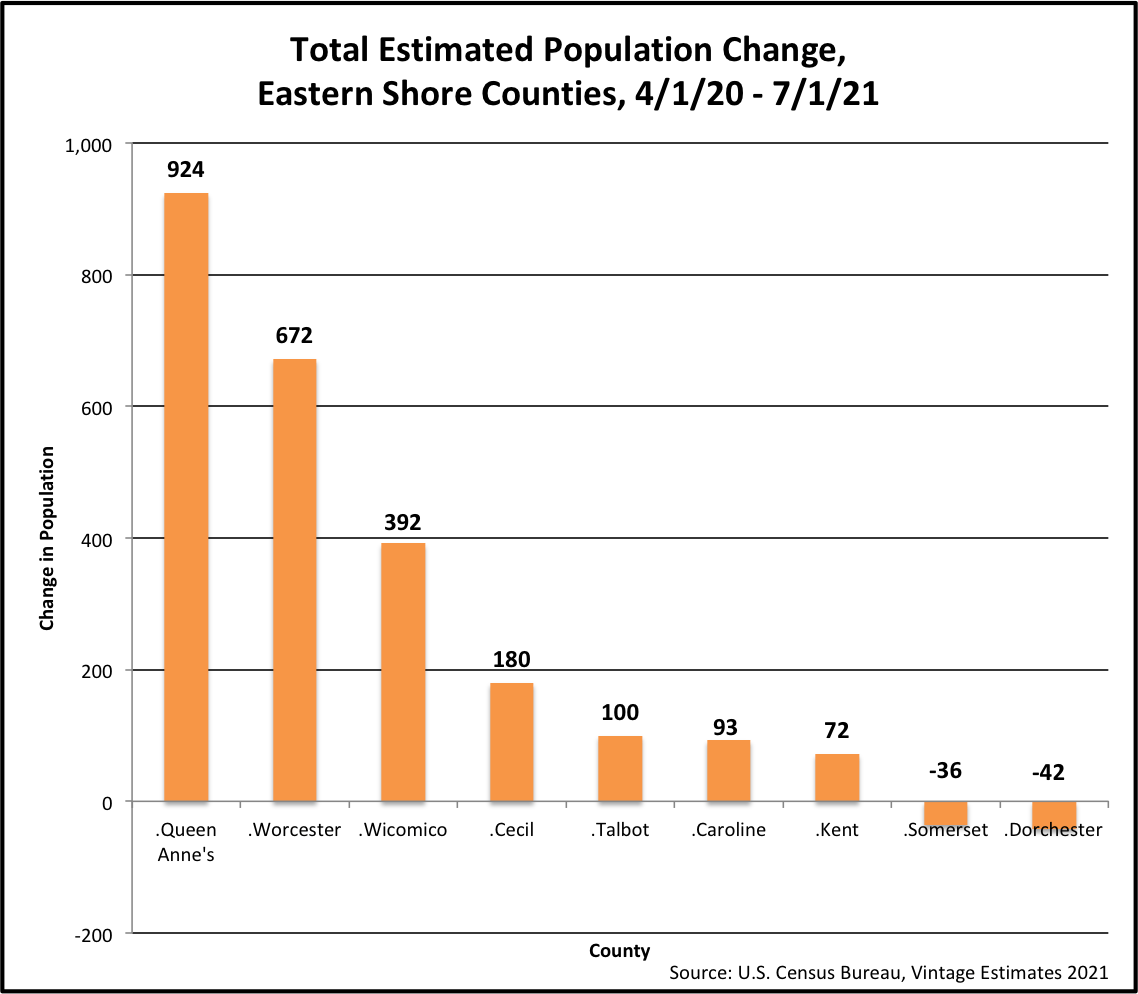
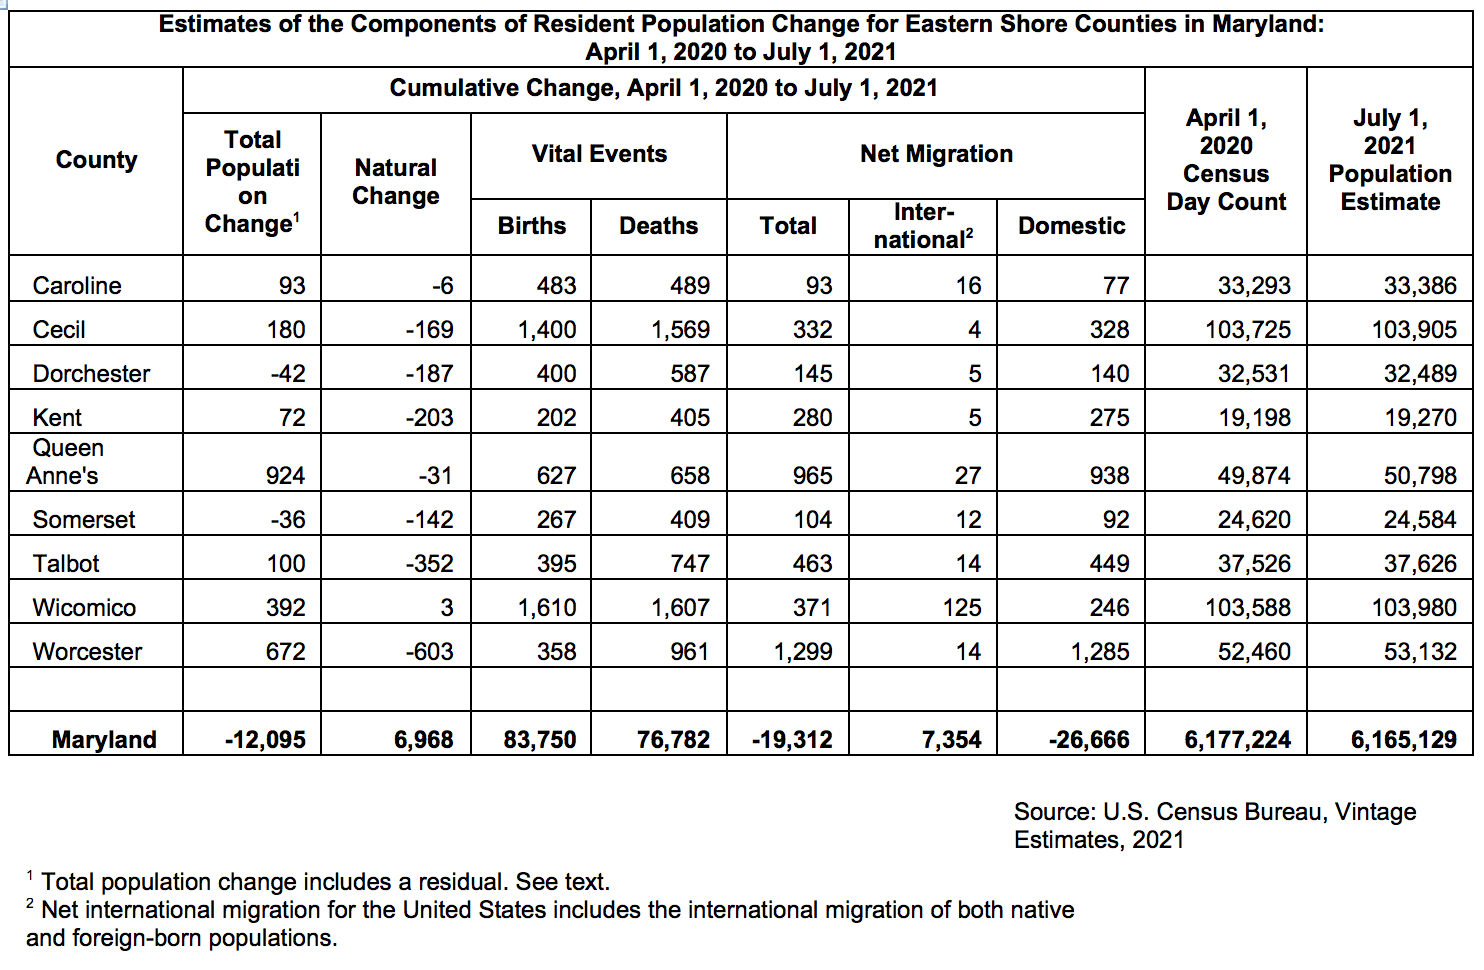
Seven of the nine Eastern Shore counties gained population between these dates, according to the Census Bureau’s 2021 Vintage Estimates. Two counties experienced small population declines.
Eight Eastern Shore counties had more deaths than births in the studied time period; this change is referred to as a “natural decrease” in population. This decline mirrored that seen in 73% of U.S. counties (up from 45% of counties in 2019 and 55% in 2020).
Worcester County had the largest natural decrease, with 2.6 times as many deaths than births. Kent was next, with twice as many deaths than births. Five counties experienced natural declines to a lesser extent. Caroline and Wicomico counties experienced pretty much equal numbers of births and deaths, according to the estimates, with Caroline seeing an estimated six more deaths than births, and Wicomico seeing an estimated three more births than deaths, the only natural increase (small as it is) on the Shore.
Then there’s migration. More people moved into the Eastern Shore counties than moved out, during the studied time period.
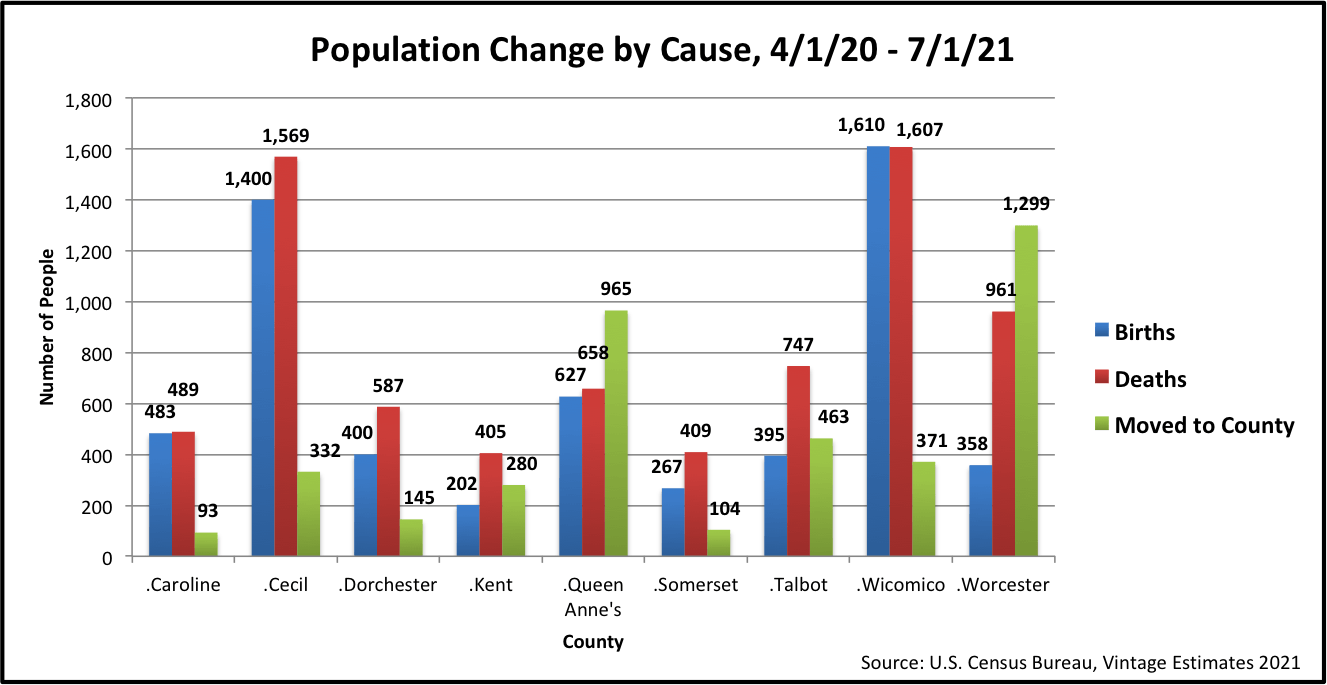
International migration was not a major factor in Eastern Shore county population changes. The Census Bureau reported that the pandemic affected international migration patterns both to and from the U.S., which resulted in the “lowest levels of international migration in decades.” Eight Eastern Shore counties experienced small net international migration gains (of between four and 27 people), with Wicomico experiencing the largest gain of 125 people.
All nine Eastern Shore counties experienced larger net domestic migration gains. The Eastern Shore benefitted from the covid-induced exodus from urban areas that created a mini-real estate boom, but many home purchases were of second homes rather than primary residences, and thus did not factor into the migration rate. Worcester County saw a net domestic migration gain of 1,285 people. Queen Anne’s County’s gain was the next largest, with 938 people. The other seven counties experienced domestic gains estimated at between 77 and 449 people.
Compare this to Maryland. Our state saw a total estimated population decrease of 12,095 people. Statewide, there were more births than deaths (unlike here on the Eastern Shore), but there was a larger net migration decrease (also unlike here).
A year has passed since July 2021 and covid is not done with us yet. Next spring we’ll be able to look at another year’s worth of population estimates.
A caveat: Because these are population estimates, and because counties are lower-level geographic entities, the total population change numbers include a “residual.” It is easier to estimate the total change in a population than it is to estimate the change that’s attributable to any of the components (births, deaths, migration). A residual is added to smooth out the estimates.
Sources:
County Population Totals: 2020-2021, U.S. Census Bureau.
https://www.census.gov/data/tables/time-series/demo/popest/2020s-counties-total.html
New Population Estimates Show COVID-19 Pandemic Significantly Disrupted Migration Across Borders. Jason Schachter, Pete Borsella and Anthony Knapp. U.S. Census Bureau, Dec. 21, 2021.
New Vintage 2021 Population Estimates Available for the Nation, States and Puerto Rico, U.S. Census Bureau, Dec. 12, 2021.
https://www.census.gov/newsroom/press-releases/2021/2021-population-estimates.html
Over Two-Thirds of the Nation’s Counties Had Natural Decrease in 2021, U.S. Census Bureau, Mar. 24, 2022.
https://www.census.gov/newsroom/press-releases/2022/population-estimates-counties-decrease.html
Jan Plotczyk spent 25 years as a survey and education statistician with the federal government, at the Census Bureau and the National Center for Education Statistics. She retired to Rock Hall.
Common Sense for the Eastern Shore


