Diversity on the Eastern Shore

The 2020 Census points out — with numbers and percentages — how the share of each race and ethnicity group on the Eastern Shore has changed since 2010. White population decreased in seven counties and stayed the same in two. Non-White population increased in eight counties and stayed the same in one. Intuitively, we can see that the shore became more diverse in that time, but to what degree?
To answer that question, the Census Bureau developed a Diversity Index. This measure is used to determine the probability that two people chosen at random in a certain place will be from different race and ethnicity groups. The DI is a percentage between 0 and 100. A value of 0 indicates that everyone in the population has the same racial and ethnic characteristics; as a population becomes more diverse, the value increases closer to 100.
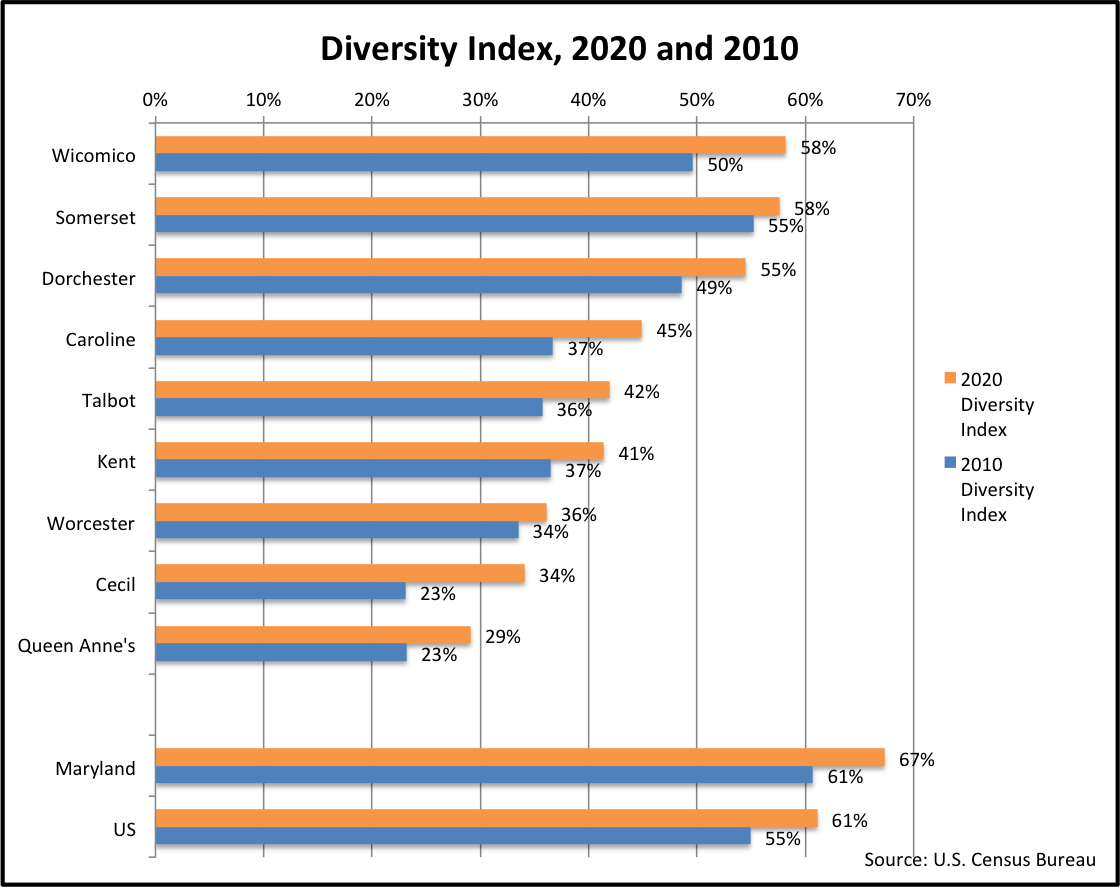
In 2010, the DI for the U.S. was calculated at 54%, indicating a probability of more than 50% that two random people would be from different racial and ethnic groups. In 2020, the national DI has increased to 61%, signifying increased diversity in the country. Maryland is the most diverse state on the East Coast, the fourth most diverse state in the country (after Nevada, California, and Hawaii), and one of a handful of states with a DI score of over 65%. Most of Maryland’s diversity comes from the Western Shore, but Eastern Shore counties are becoming more diverse, as evidenced in the 2020 Census data. The Shore’s most diverse counties are Wicomico, Somerset, and Dorchester, each with a diversity score of over 50%. The least diverse county is Queen Anne’s, with a diversity score of 29%. No Eastern Shore county has a DI equal to or greater than Maryland or the U.S.

The Census Bureau’s Diversity Index shows increasing diversity in all Eastern Shore counties, as well as Maryland and the U.S.
Source: U.S. Census Bureau
To drill down even farther, the Washington Post has provided a cool DI lookup tool, where you can see how the racial makeup of the census tract where you live has changed since 1990.
Enter an address or zipcode into the lookup tool to see the trend over time, and compare that to your county and the U.S. as a whole.
Using this tool, I discovered that my census tract, in the Rock Hall 21661 zipcode in Kent County, is one of the least diverse, and most White, places in the country (84% White population, DI score of 29%). What about your neighborhood?
For more information:
Racial and Ethnic Diversity in the United States: 2010 Census and 2020 Census, U.S. Census Bureau
How the Racial Makeup of Where You Live has Changed Since 1990, Kate Rabinowitz, Leslie Shapiro, Hannah Dormido, Ted Mellnik, Aug. 16, 2021.
https://www.washingtonpost.com/nation/interactive/2021/racial-makeup-census-diversity/
Jan Plotczyk spent 25 years as a survey and education statistician with the federal government, at the Census Bureau and the National Center for Education Statistics. She retired to Rock Hall.
Common Sense for the Eastern Shore


