Eastern Shore Data Briefs: Four Demographic Measures

A special place, Maryland’s Eastern Shore is extraordinary in many ways to those of us who live, work, and vacation here. But it is not a monoculture. Each of its nine counties has a flavor of its own and characteristics that distinguish it from the others. And luckily for us, we have access to data that can highlight the ways in which the counties are unique.
This edition of Eastern Shore Data Briefs will look at four randomly chosen demographic measures by county: median age, percent of population that is a high school graduate or higher, percent foreign born, and average household size.
These data are from the American Community Survey (ACS), a program of the U.S. Census Bureau. ACS replaced the decennial census long form in 2010. ACS asks questions of a representative, randomized sample of about three-and-a-half million U.S. residents in order to produce yearly estimates of detailed social, demographic, housing, and economic information. The data are aggregated, and no names are released. ACS data are used by Congress to determine the yearly allocation of $625 billion of federal funds, by state and local policy makers, by businesses, and by civil rights and community groups.
The estimates in the tables below are from ACS 2016-2020. The five-year estimates enable data from smaller jurisdictions — like Eastern Shore counties — to be released; the ACS is often the only source of these data for rural and small communities.

The federal government has a vested interest in our ages. Age is critical to a large number of federal programs that target funds or services to children, working-age adults, women of childbearing age, or the older population. The U.S. Department of Education uses age data in its formula for allotment to states. The Veterans Administration uses age data to determine the need for hospitals, nursing homes, cemeteries, domiciliary services, and other benefits for veterans.
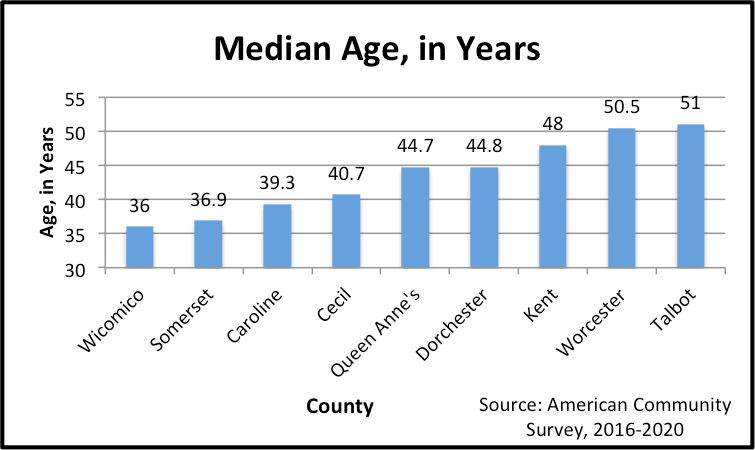
Median age is the age that divides the population into two equal-size groups: Half of the population is older than the median age and half is younger.
Wicomico and Somerset counties have the lowest median ages on the Eastern Shore, at 36 and 36.9 years — generally an indication of a younger population base. In 2023, the median age of the U.S. was 38.5 years (up from 29.5 years in 1960), and the median age of Maryland was 38.8 years in 2020. The rest of the Shore counties have a higher median age than the U.S. and Maryland, and the retirement meccas of Kent, Worcester, and Talbot counties have the highest.
Fun facts: The median age of U.S. senators is 65. The median age of congress members is 59. Compared to that, we look positively young on the Shore.

Educational attainment data are widely used. They are needed to determine the extent of illiteracy rates of citizens in language minorities in order to meet statutory requirements under the Voting Rights Act. Based on data about educational attainment, school districts are allocated funds to provide classes in basic skills to adults who have not completed high school.
The category ‘high school graduate or higher’ includes people 25 years and older whose highest degree was a high school diploma or its equivalent, people who attended college but did not receive a degree, and people who received an associate’s, bachelor’s, master’s, or professional or doctorate degree. People who reported completing the 12th grade but not receiving a diploma are not included.
Eastern Shore county data for this educational attainment category ranges from 84% of residents in Somerset County to 93% in Queen Anne’s. Percent of high school graduate or higher was 89% for the U.S. for the same time period, and 91% for Maryland.

The foreign-born population (also referred to as immigrant population) includes anyone who was not a U.S. citizen at birth. This includes respondents who indicated they were a U.S. citizen by naturalization or not a U.S. citizen.
The ACS questionnaires do not ask about immigration status. The population surveyed includes all people who indicated that the U.S. was their usual place of residence on the survey date. The foreign-born population includes naturalized U.S. citizens, lawful permanent residents (i.e., immigrants), temporary migrants (e.g., foreign students), humanitarian migrants (e.g., refugees), and unauthorized migrants (i.e. people illegally present in the United States).
Compared with national and state totals, the Eastern Shore counties have relatively small foreign-born populations, ranging from 3.7% in Somerset to 8.2% in Wicomico. In 2021, immigrants comprised 13.6% of the total U.S. population; in Maryland this was 15% of population.
In Maryland:
- More than half of all immigrants are naturalized U.S. citizens
- More than four in five immigrants reported speaking English “well” or “very well”
- 81% of immigrants are high school graduates or higher
- 7,870 active Deferred Action for Childhood Arrivals (DACA) recipients lived in Maryland as of March 2020 (DACA has been granted to 9,932 people total since 2012)
- One in five workers in Maryland is an immigrant
- In 2018, immigrant-led households in Maryland paid $8 billion in federal taxes and $4.1 billion in state and local taxes
- Nearly a third of all Maryland healthcare support workers are immigrants, as are more than a third of the state’s building maintenance workers and groundskeepers
- Immigrant business owners accounted for 23% of all self-employed Maryland residents and generated $1.7 billion in business revenue

A household includes all the people who occupy a housing unit. A housing unit is a house, an apartment, a mobile home, a group of rooms, or a single room that is occupied as separate living quarters. The occupants may be a single family, one person living alone, two or more families living together, or any other group of related or unrelated people who share living arrangements.
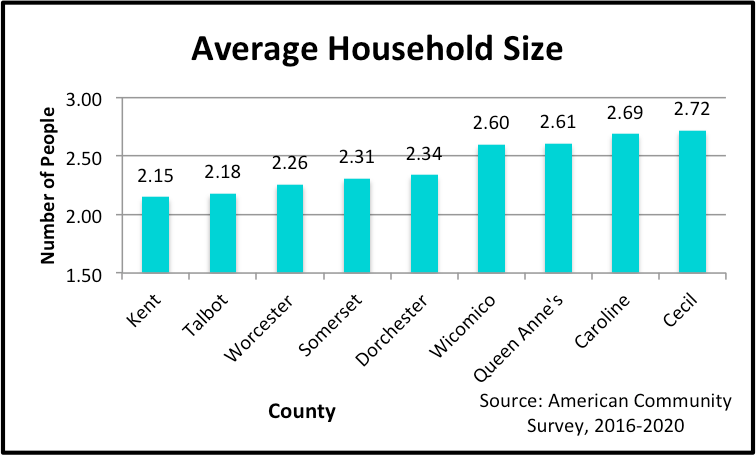
Average household size is obtained by dividing the number of people in households by the number of households.
Urban and regional planners rely on average household size for many of their models, calculations, and plans.
Average household size (also known as "people per household") is a reflection of many elements, for example:
- Age of the population, as many older people tend to live in smaller households (one-person or two-person households)
- Housing prices in the area, proximity to colleges and universities, and how likely people are to live with roommates
- Family norms and traditions (e.g., multigenerational families are more common in some areas and with some population groups)
The average household in the U.S. was 5.79 people in 1790. By 2010, the average was down to 2.58, due to a declining fertility rate and the rise of the nuclear family in the intervening centuries. However, the size of households has been increasing slightly since then, resulting in an average household size of 2.61 people per household in 2023 — indicating an increase in multigenerational households and more shared living arrangements after the Great Recession of 2007-09.
By 2016, 20% of Americans lived in a multigenerational household, up from 12% in 1980. And in 2019, 20% of households were shared households, up from 17% in 2007.
Maryland’s average household size was 2.64 in 2023.
Four of the Shore counties hover around the U.S. and Maryland average. The exceptions are the retirement magnets (Kent, Worcester, and Talbot), and Somerset and Dorchester, all with lower average household sizes.
It’s important to keep an eye on this federal program, and ensure that it continues to be funded adequately. In 2012, the GOP-led House voted to eliminate the survey altogether, on the grounds that the government should not be “butting its nose into Americans’ homes.”
The bill’s sponsor, Daniel Webster (R-Fla.), complained that the survey is unconstitutional (it’s not) and that it “is a program that intrudes on people’s lives, just like the EPA or the bank regulators. What really promotes business in this country is liberty, not demand for information.”
That bill was not successful. The ACS has continued to be funded: $2.52 million was appropriated for FY2023, and $2.59 million has been requested for FY2024. The freedom-loving sentiments expressed by Rep. Webster more than 10 years ago have only strengthened in the time since, however. If the GOP ever gets around to releasing its budget proposal, the American people will discover the importance of data driven decision making to that sector of our legislators.
Jan Plotczyk spent 25 years as a survey and education statistician with the federal government, at the Census Bureau and the National Center for Education Statistics. She retired to Rock Hall.
Common Sense for the Eastern Shore


