High Tide Flooding — More Than a Nuisance
All of us who live on the Delmarva Peninsula know what we’re up against with climate change — along with rising sea levels, more powerful storms, and deeper storm surges, we must contend with increased high tide flooding.
The 14 Delmarva counties are all low-lying, so we’re well-versed concerning what happens with even the slightest increase in water level. The lowest point in all Delmarva counties is 0 feet, either at the Chesapeake Bay, Delaware Bay, or the Atlantic Ocean. The northernmost counties of Maryland and Delaware have the highest elevations, with Cecil County at 535 feet and New Castle County at 450 feet. Kent County, Md. is next at 102 feet. But the majority of the Delmarva counties have highest elevations below 90 feet (the distance between first and second base, or the height of a nine-story building), ranging from 87 feet in Queen Anne’s to 46 feet in Somerset (for comparison, a standard telephone pole is 36 feet high).
High tide flooding (HTF) occurs when an ocean, bay, or river inundates low-lying areas during high tides. It’s typically defined as about 1.75 feet above high tide as measured by National Oceanic and Atmospheric Administration (NOAA) tide gauges.
HTF is also referred to as nuisance or sunny-day flooding, but those labels trivialize its effects. While each flooding event is temporary and inconvenient, repeated flooding can compromise infrastructure by damaging storm and wastewater systems and roadways. Sandy beaches and marshes are also at risk.
The effects of high tide flooding are compounded when coastal storms coincide with high tides. Winds and rainfall during high tide events can increase flooding substantially.
King tides can also exacerbate high tide flooding. King tides occur a few times a year, when the moon’s orbit brings it closest to earth during a new or full moon, and the earth, moon, and sun are in a straight line. These conditions result in tides that are much higher than usual. King tides are responsible for high tide events that make news across the globe, for example, the acqua alta in Venice, Italy.
Then there’s our “wobbly” moon (actually less like a wobble and more like a predictable cycle). High and low tides on earth are caused by the moon’s gravitational force. The moon’s orbit around the earth is tilted by about 5 degrees, and on an 18.6-year cycle this angle sometimes stems the levels of the earth’s tides, and sometimes increases them. This lunar characteristic is a phenomenon that was discovered in the 18th century so it’s nothing new or alarming, but coincidentally in the next few decades, the wobbly moon will be at the point in its cycle that will make tides higher.
But the main reason for high tide flooding events and their increasing occurrence is climate change.
A recent NOAA report, 2021 State of High Tide Flooding and Annual Outlook, discusses HTF and forecasts the rate of flooding events for the next 30 years. The report states that high tide flooding events are increasing, and that last year, nationally, coastal communities experienced HTF at an average rate of four days per year — twice as often as 20 years ago.
By 2030, the national median HTF frequency rate is likely to increase by about two to three times (to 7–15 days per year) in the absence of flood management efforts; by 2050, the frequency is likely to increase five to 15 times (to 25–75 days per year). In addition to minor flooding events, moderate and major HTF (which start at about 2.75 feet and 4 feet above high tide) will become much more commonplace; these events can cause significant risks to life and property.
NOAA maintains 200 permanent coastal tide gauge stations along the country’s coastlines. Tide data are used for many things, especially to record and predict sea level trends and to support emergency response preparedness. Some tide stations have been in place for over 100 years so they provide a rich compilation of time series data.
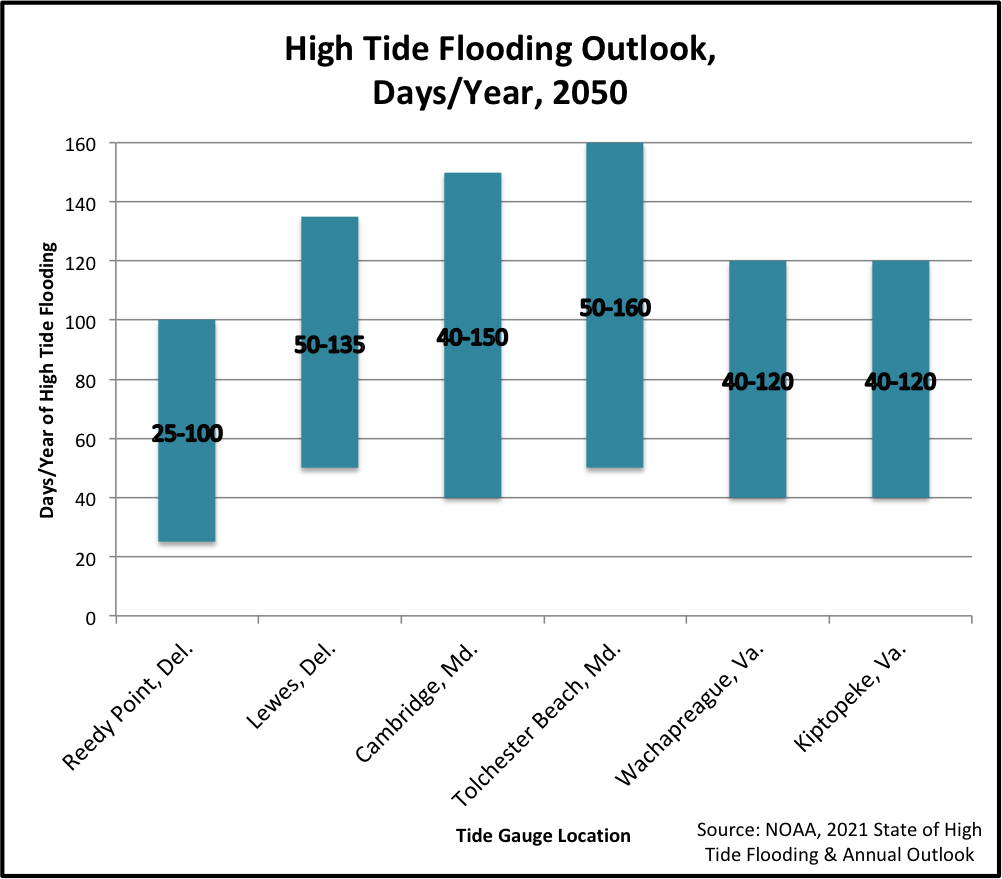
The 2021 NOAA report includes data from six Delmarva tide gauge stations:
- Reedy Point, Del., where the C&D Canal meets the Delaware Bay, just south of Delaware City;
- Lewes, Del., on the Delaware Bay side of Cape Henlopen in Breakwater Harbor;
- Cambridge, Md., on the Bill Burton Fishing Pier, Choptank River;
- Tolchester Beach, Md., on the Chesapeake Bay at the marina;
- Wachapreague, Va., behind the Virginia Institute of Marine Sciences' Eastern Shore Laboratory on the Wachapreague Channel from the Atlantic Ocean;
- and Kiptopeke, Va., at the end of a wharf that sticks out into the Chesapeake Bay.
The predictions for 2021 high tide flooding events in the six tide gauge locations are relatively modest: from 1-3 days per year at Reedy Point to 8-15 days per year in Wachapreague.
The predictions for the 2030 HTF events are on average two and three quarters times higher than for 2021, much like the national predictions.
By 2050, NOAA predicts between 25 and 100 days of flooding per year at Reedy Point, and between 50 and 160 days per year at Tolchester Beach — that is, between three and a half and six times of the rate in 2021. (One hundred days per year is eight days per month; 160 days per year is 13 days per month, or over 40% of a month.)
With the frequency of HTF events increasing, the cumulative effects of flooding events include damage to infrastructure and other economic and ecosystem consequences within coastal communities. It’s vital that affected communities search for solutions and implement abatement plans. Maryland law requires all local jurisdictions that experience HTF to develop a plan to address it. Delaware convened a Cabinet Committee on Climate and Resilience to recommend state action on several climate issues, including flood avoidance. Virginia has allocated tens of millions of dollars in grant money for local jurisdictions to implement flood resilience plans. And NOAA has pledged to continue to provide the data needed by communities to respond to this threat.
But along with addressing this result of climate change, it’s essential that we address the causes of climate change. A recent poll by the Pew Research Center found that 60% of Americans are somewhat or very concerned that climate change will personally hurt them during their lifetimes. And 74% of Americans are willing to make at least some changes to their lives to help reduce the effects of climate change. It’s clear that public perception is shifting on this issue in a positive direction — we need to use this momentum to make big changes.
Sources:
National Ocean Service, What is High Tide Flooding?
https://oceanservice.noaa.gov/facts/high-tide-flooding.html
National Oceanic and Atmospheric Administration, 2021 State of High Tide Flooding and Annual Outlook.
National Ocean Service, What is Resilience?
https://oceanservice.noaa.gov/facts/resilience.html
Pew Research Center, In Response to Climate Change, Citizens in Advanced Economies Are Willing To Alter How They Live and Work, 9/14/21.
Critical Area Commission for the Chesapeake and Atlantic Coastal Bays, Critical Area Coastal Resilience Planning Guide, 2017
https://dnr.maryland.gov/criticalarea/Documents/Coastal_Resilience_Planning_Guide.pdf
NOAA, Coastal Inundation Dashboard.
https://tidesandcurrents.noaa.gov/inundationdb/
Resources:
Coastal Resilience, a program led by The Nature Conservancy
https://coastalresilience.org/
U.S. Climate Resilience Toolkit
https://toolkit.climate.gov/topics/coastal-flood-risk/shallow-coastal-flooding-nuisance-flooding
Example Plans:
Kent County (Md.) Nuisance Flooding Plan.
https://www.kentcounty.com/images/pdf/planning/KC_Nuisance_Flooding_Plan.pdf
Town of Denton (Md.) Nuisance Flooding Plan
https://dentonmaryland.com/wp-content/uploads/2020/08/Resolution-877-Nuisance-Flooding-Plan.pdf
Jan Plotczyk spent 25 years as a survey and education statistician with the federal government, at the Census Bureau and the National Center for Education Statistics. She retired to Rock Hall.
Common Sense for the Eastern Shore


