How Much Renewable Energy on the Eastern Shore?

To avoid the worst impacts of climate change, climate scientists agree that we must significantly reduce the use of fossil fuels and transition to the use of renewable energy sources ASAP — in the next few decades, if not sooner.
Thirty states plus Washington, D.C., have established targets for the percentage of renewable energy sold by utilities in their states. Called Renewable Energy Portfolio Standards (RPS) or Clean Energy Standards (CES), the specific targets and definitions differ from state to state. But the goal of the standards is the same: to diversify the states’ energy mix, to reduce emissions, and to promote economic development. The National Conference of State Legislatures estimates that “roughly half of the growth in U.S. renewable energy generation since the beginning of the 2000s can be attributed to state renewable energy requirements.”
Renewable energy is from a source that is not depleted when used, such as wind or solar power. Hydroelectric power, biomass, and geothermal are also considered renewable sources of energy. Clean energy typically refers to sources of energy that have zero carbon emissions. The two categories often overlap.
Maryland’s RPS, enacted in 2004, initially required that 20% of energy in the state be from renewable sources by 2022. Since then, the targets have been raised several times. In 2019, the RPS was raised to 50% renewable by 2030 (14.5% of that from solar), and a goal of 100% renewable energy by 2040. There are additional goals for offshore wind: 400 megawatts by 2026 and 1,200 megawatts by 2030.

So, how much are the nine Eastern Shore counties contributing to Maryland’s renewable energy goals? There is a handy online tool, WeatherPower by Climate Central, that can show us how much solar and wind energy the counties generate.
Climate Central is an independent organization of scientists and journalists that surveys and conducts scientific research on climate change, and informs the public of key findings. Their WeatherPower tool estimates and predicts the amount of solar and wind energy generated per day by county or state. Solar estimates include both utility-scale and residential installations. A complete description of methodology is available on the website.
Common Sense retrieved solar power data from WeatherPower for each Eastern Shore county for a sunny day (Sept. 29) and a cloudy day (Oct. 6). Results are shown in the chart below.

Chart 1. Approximate Solar Electricity Generated in Eastern Shore Counties, on a Sunny Day and Cloudy Day.
Source: WeatherPower by Climate Central
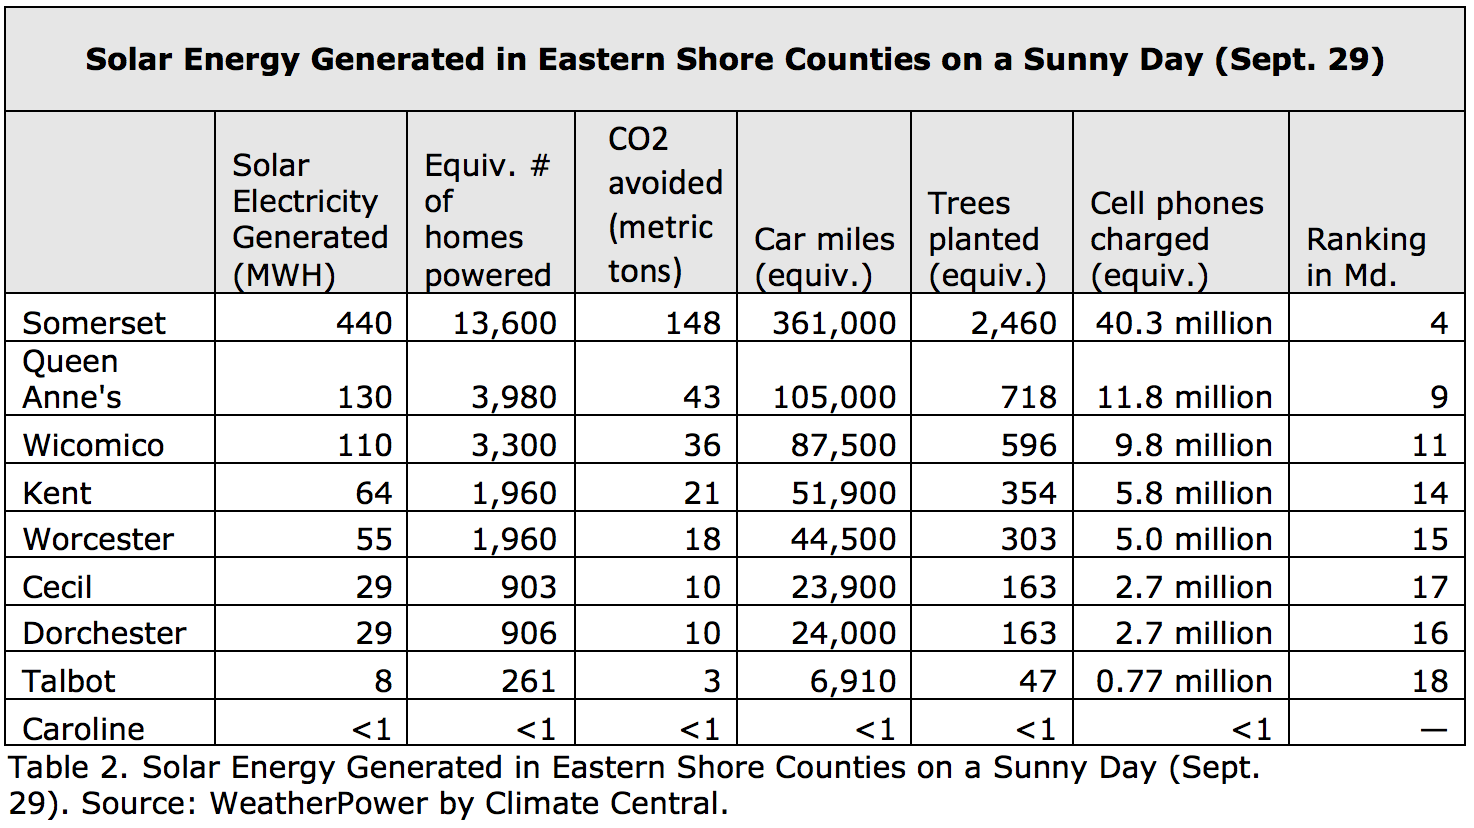
Somerset County is the leading solar energy producer among Eastern Shore counties, producing approximately 440 megawatt-hours (MWH) of electricity on the sunny day studied, and 260 MWH on the cloudy day. Queen Anne’s and Wicomico counties were next, both with over 100 MWH on the sunny day, and 59 and 60 on the cloudy day. All the other counties generated less than 100 MWH on the sunny day and less than 30 on the cloudy day. (Caroline County did not have measurable solar energy production estimated.)
How much energy is this? Well, one megawatt-hour powers roughly 33 homes for a day. Somerset County’s 440 MWHs would power an estimated 13,600 homes for a day.

Another way to look at the generation of solar electricity is by the amount of carbon dioxide (CO2) avoided. This measurement estimates the number of metric tons of CO2 that would have been emitted on average by fossil-fuel power plants operating in the state to produce the same amount of electricity as generated from the sun.
How much is a metric ton of CO2? According to the MIT Climate Portal, a metric ton is roughly equivalent to a cube measuring 27 feet on each side, filled with CO2. And, yes, this literally weighs a ton, even though it may seem like a gas couldn’t possibly weigh that much.
Somerset County generated enough solar energy to avoid the emission of 148 metric tons of CO2, or 148 of our 27-foot cubes.
Once the amount of CO2 avoided is estimated, calculations can then be made of human-scale equivalents, like:
- Car Miles — The number of miles an average car would need to be driven to emit the same amount of CO2 as in the 'CO2 Avoided' estimate. Somerset County saved the equivalent of 361,000 car miles — on one sunny day.
- Trees Planted — The number of tree seedlings planted and grown for ten years that it would take to absorb the same amount of CO2 from the air as in the 'CO2 Avoided' estimate. Somerset County “planted” the equivalent of 2,460 trees by generating the solar energy it did.
- Smartphones Charged — The number of typical smartphones that could be charged using the amount of electricity generated from the sun. Somerset County charged the equivalent of 40.3 million cell phones.
On Sept. 29, Somerset County ranked #4 among Maryland counties in generation of solar energy (Prince George’s was #1, Montgomery was #2, and Baltimore County was #3). Rankings can vary daily.
Maryland ranked #15 among all states in solar energy generation on Sept. 29. On our sunny day, Maryland generated 5,700 MWH of solar energy, for a total of 1,890 metric tons of CO2 avoided.
Only two Eastern Shore counties generate wind energy: Somerset and Talbot. Somerset County is, again, the leader on the Shore, having generated 4 MWH of wind energy on Sept. 29 and 3 MWH on Oct. 6. There was very little wind on both of these days, but nevertheless, over one metric ton of CO2 was avoided.
Most of Maryland’s wind energy generation is in the western part of the state, with 160 MWH generated by Garrett County on September 29. Maryland’s total for that day was 170 MWH.
Once the offshore wind farms are built in the Atlantic Ocean off Ocean City, however, Worcester County will account for quite a lot of wind energy. Ørsted, the developer of two wind farms off Ocean City (one approved and one proposed), estimates that Skipjack 1 (operational in 2026) will generate 120 MWH per day (enough to power 40,000 homes), and the proposed Skipjack 2 installation would generate 760 MWH (250,000 homes). US Wind, developer of the MarWin project (2025), predicts 270 MWH of wind energy will be generated daily (80,000 homes).
Maryland has set ambitious goals for renewable energy. There is just shy of two decades to build the infrastructure needed to meet Maryland’s target for 100% renewable energy by 2040 — hence, a need for haste.
Sources:
National Conference of State Legislatures, State Renewable Portfolio Standards and Goals.
https://www.ncsl.org/research/energy/renewable-portfolio-standards.aspx
Maryland at a Glance — Energy.
https://msa.maryland.gov/msa/mdmanual/01glance/html/energy.html
WeatherPower by Climate Central.
https://weatherpower.climatecentral.org/forecast/
MIT Climate Portal, How Much is a Ton of Carbon Dioxide?
https://climate.mit.edu/ask-mit/how-much-ton-carbon-dioxide
Jan Plotczyk spent 25 years as a survey and education statistician with the federal government, at the Census Bureau and the National Center for Education Statistics. She retired to Rock Hall.
Common Sense for the Eastern Shore


