What Do the New Census 2020 Data Tell Us About the Eastern Shore?

The 2020 U.S. Census redistricting data have some interesting things to say about the Eastern Shore counties. Redistricting data, released last August, are the first data from the 2020 Census that let us see demographic and population changes around the nation. States typically use these data for redistricting — the process of redrawing electoral district boundaries every 10 years based on where their populations have increased or decreased. Hence the name.

Chart 1. Total Population of Eastern Shore Counties, 2020. Source: U.S. Census Bureau.
Different counties experienced different population shifts between 2010 and 2020. The total population of the Eastern Shore now sits at 456,815, an increase of 7,589 over 2010.

Chart 2. Gain or Loss of Population in Eastern Shore counties, 2010 to 2020. Source: U.S. Census Bureau.
Total population rose between 2010 and 2020 in five Eastern Shore counties and dropped in four. Wicomico was the big winner, with an increase of 4,855. Cecil and Queen Anne’s each gained over 2,000 in population, and Worcester just about 1,000. Caroline’s population increased by 227. On the other hand, Somerset County lost 1,850 people; Kent lost 999; Talbot lost 256, and Dorchester lost 87.

The Eastern Shore’s White population fell in seven counties and stayed about the same in two (Queen Anne’s and Worcester), for a cumulative loss of 17,691 across the Shore.

Chart 3. Percent of Non-White Population in Eastern Shore counties, 2020 and 2010. Source: PEW Charitable Trusts, using U.S. Census Bureau data.
Non-White population, however, rose in eight counties and was steady in one (Somerset). No Eastern Shore county became majority non-White in 2020, but the state of Maryland did (and there are four majority non-White counties in Maryland: Baltimore City, Howard, Montgomery, and Prince George’s).
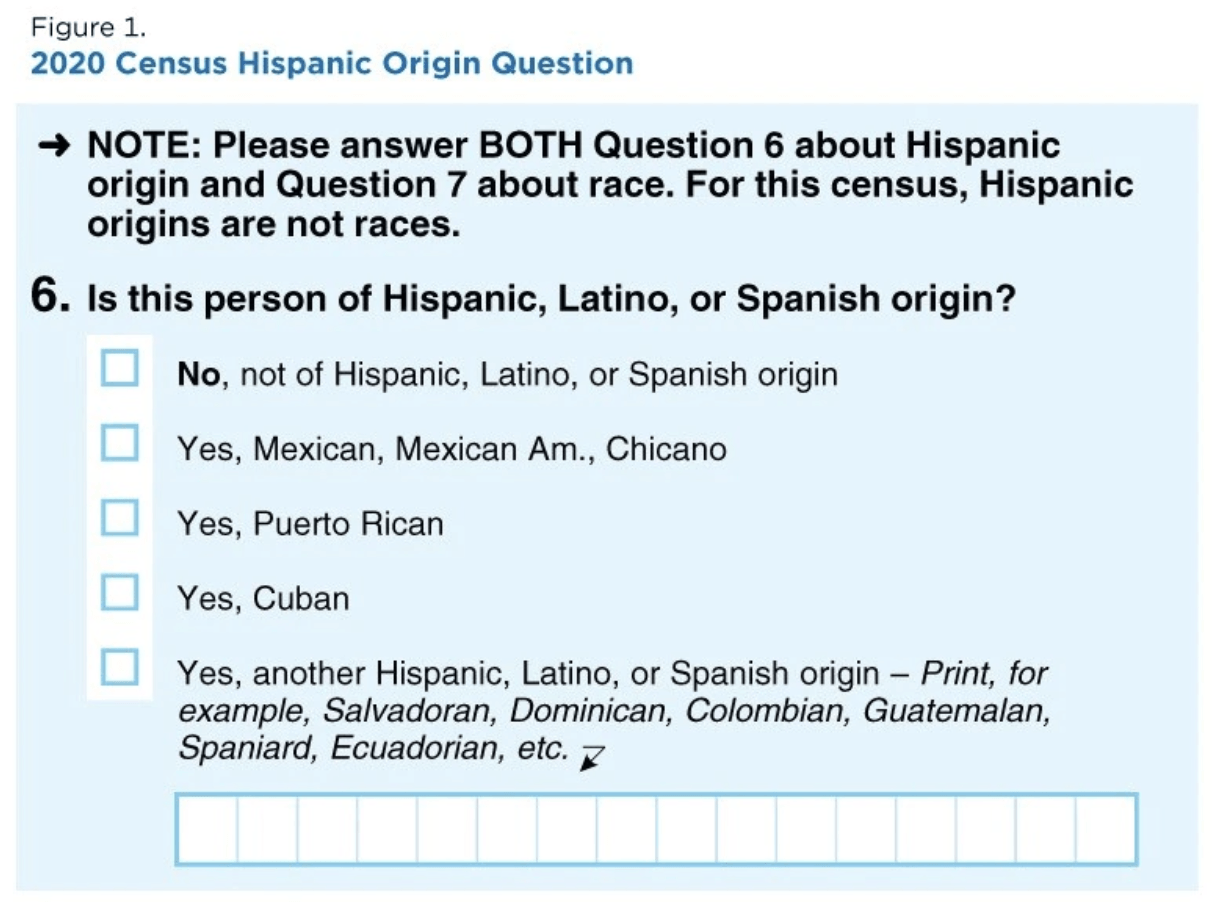
In the U.S. Census, Hispanic heritage is considered an ethnicity, distinct from race. Ethnicity and race were asked as separate questions, and respondents were instructed to answer both. If the respondent provided at least one Hispanic origin response, they were tabulated as Hispanic. For the race question, respondents were given the opportunity to designate multiple categories through the use of checkboxes and write-in boxes.

Figure 1. 2020 Hispanic Origin Question. Source: U.S. Census Bureau.

Figure 2. 2020 Census Race Question. Source: U.S. Census Bureau.
When respondents checked one race category, answers were aggregated into the following major race and ethnicity groups:
- Hispanic or Latino
- Non-Hispanic, White
- Non-Hispanic, Black or African American
- Non-Hispanic, American Indian or Native American
- Non-Hispanic, Asian
- Non-Hispanic, Native Hawaiian or Other Pacific Islander
- Non-Hispanic, Some Other Race
Additionally, tabulations were made for responses with multiple categories marked:
- Non-Hispanic, population of two races (e.g., White and Asian; Black and Native American)
- Non-Hispanic, population of three races (e.g., Black and Asian and Some Other Race)
- Non-Hispanic, population of four races
- Non-Hispanic, population of five races
- Non-Hispanic, population of six races (i.e., all the major categories)

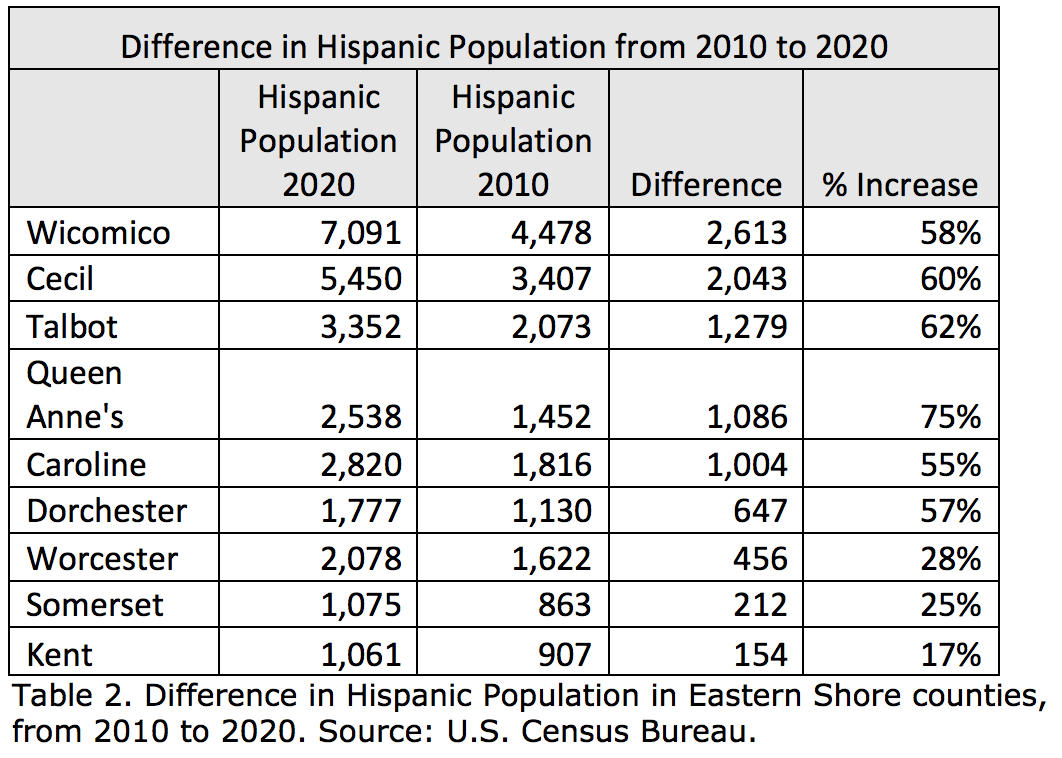
On the Eastern Shore in 2020, Hispanic population increased in all nine counties.

Non-Hispanic Black population increased in four counties (Wicomico, Cecil, Dorchester, and Caroline) and decreased in the other five.

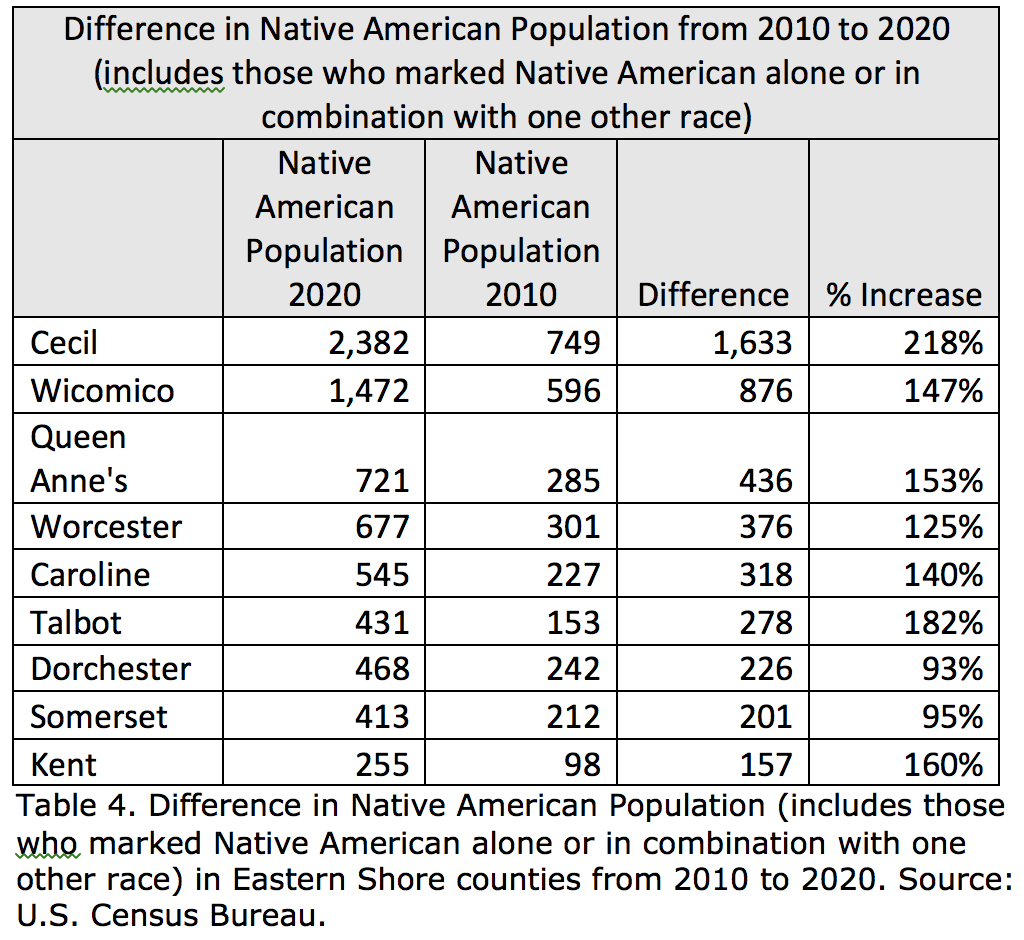
Non-Hispanic Native American population increased in all nine counties, mirroring what happened across the state, where Native American population counts doubled since 2010. Cecil, Talbot, and Kent saw the highest percentage increase of this group on the Shore. While the numbers are typically lower on the Eastern Shore for Native Americans than for Hispanics, Whites, and Blacks, these rates of increase are noteworthy. Marylanders who identified in part or totally as American Indian make up about 2% of the state’s 6.1 million residents, totaling 128,650 individuals. Nationally, Native Americans increased by 85% from 2010 to 2020, to 9.7 million people.
This large increase can be at least partially attributed to grassroots efforts by local Indigenous communities to better document themselves in official records. Historically there have been problems with recording multiple race backgrounds on government forms and with census taker bias, and often Native American heritage was not recorded in favor of other races. The improved census forms allow a more complete picture of everyone’s heritage to be shown.
“The big push is to be counted so we get a better reflection of where we’re living and how we’re living, as well as access to things like insurance and education,” according to Kerry Hawk Lessard, executive director for Native American LifeLines in Baltimore, a nonprofit health services organization. Hawk Lessard’s organization, like many across the country, used social media and outreach events to encourage participation by Native Americans in the 2020 Census.
The State of Maryland has formally recognized three tribes and the Maryland Commission on Indian Affairs serves those plus an additional five tribes, several on the Eastern Shore.
Rural areas experienced population loss across the country, and most areas saw a change in the racial and ethnic makeup of their residents. In future issues we will explore other insights from the Census 2020 data. Stay tuned.
Sources:
2020 Census Redistricting Data.
“Census data shows Maryland is now the East Coast’s most diverse state, while D.C. is Whiter,” Marissa J. Lang and Ted Mellnik, The Washington Post, August 12, 2021.
https://www.washingtonpost.com/dc-md-va/2021/08/12/dc-virginia-maryland-census-redistricting-2/
“Improvements to the 2020 Census Race and Hispanic Origin Question Designs, Data Processing, and Coding Procedures,” Rachel Marks and Merarys Rios-Vargas, U.S. Census Bureau, August 3, 2021.
“Southern Counties Lose Their White Majorities, Threatening GOP,” Tom Henderson, The Pew Trusts, Stateline, August 26, 2021.
“More Marylanders now identify as Indigenous amid call for more accurate record keeping,” Lillian Reed, The Baltimore Sun, Oct. 11, 2021.
“Indigenous Peoples of the Chesapeake,” Chesapeake Bay Program.
https://www.chesapeakebay.net/discover/history/archaeology_and_native_americans
Jan Plotczyk spent 25 years as a survey and education statistician with the federal government, at the Census Bureau and the National Center for Education Statistics. She retired to Rock Hall.
Common Sense for the Eastern Shore


