Queen Anne's County Profile


Quick Facts:
Queen Anne’s County is called the “Gateway to the Eastern Shore” because of the Chesapeake Bay Bridge connection to the rest of the state. The majority of the county’s population, and its commercial and industrial base, are on Kent Island, where the bridge terminates. The rest of the county has managed to remain largely rural; the overall population density is 129 people per square mile.
- Land area is 372 square miles
- Water area is 139 square miles (27% of total area)
Almost a third of Queen Anne’s agricultural, forested, and important natural and water resource lands is preserved; 12% of agricultural and resource lands are under threat of development inconsistent with state goals for land and resource conservation.
Proposals for a third bay bridge (or an eight-span replacement of the two existing bridges) include plans for building new approach highways clear across Kent Island and Kent Narrows, as far as the U.S. 50 / U.S. 301 split, a distance of 12 miles.
The Queen Anne’s County population is predominantly White, well-educated, and well off.
Population breakdown by race and ethnicity:
- 84% White, non-Hispanic
- 6% Black, non-Hispanic
- 5% Hispanic
- 5% Other, non-Hispanic
A little more than half of Queen Anne’s population is under 40.
Thirty percent of Queen Anne’s residents have an associate or bachelor’s degree, the highest percentage on the Eastern Shore, and higher than Maryland. An additional 14% have a graduate or professional degree. At 44% of residents with a higher education degree, Queen Anne’s County is the best educated county on the Eastern Shore.
Queen Anne’s County’s median household income is $85,900 — the highest on the Shore and eighth highest in Maryland — compared with $76,100 for the state as a whole.
Between 2012 and 2016, 59% of the workforce commuted outside the county to work, the majority of those across the bridge.
In 2015, 25% of homeowners paid more than 35% of their income on housing costs (lowest percentage on the Shore); 42% of renters paid more than 35% of their income for rent (third lowest). Only 5.2% of county residents don’t have health insurance (lowest).
In May 2022, Queen Anne’s County’s unemployment rate (not seasonally adjusted) was 2.8%, the lowest on the shore. Maryland’s was 3.7%.
In Queen Anne’s, 6.5% of the population is at or below the poverty level — lowest level on the shore — compared with 9% statewide.
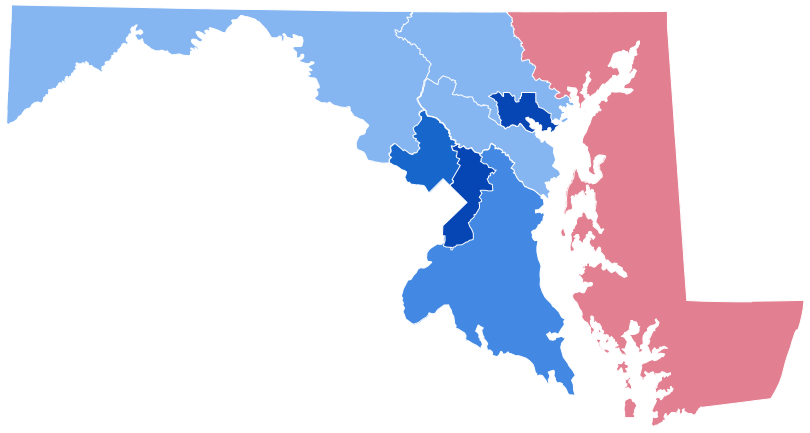
Half of Queen Anne’s voters are registered Republicans — the reddest county on the shore. Twenty-nine percent are Democrats. For the last half century, the county has voted for the Republican presidential candidate in every election by a large margin, except in 1976, when Jimmy Carter lost the county by 22 votes.
Sources:
U.S. Census Bureau, 2020 Decennial Census, Hispanic and Not Hispanic by Race
Statistical Atlas, Maryland
https://statisticalatlas.com/state/Maryland
Maryland Department of Planning Data Center, Sustainability Indicators
https://planning.maryland.gov/MSDC/Pages/sustainability_indicator/sustainabilityindicator.aspx
Maryland State Board of Elections, Eligible Active Voters, 2020 Presidential Election
Maryland Department of Labor, Local Area Unemployment Statistics
https://www.dllr.state.md.us/lmi/laus/
Wikipedia, Queen Anne’s County, Md.
https://en.wikipedia.org/wiki/Queen_Anne%27s_County,_Maryland
Queen Anne’s County website, Floodplain information
Brief Economic Facts, Queen Anne’s County, Md.
https://qac.org/DocumentCenter/View/10865/2018BEFQAC
Jan Plotczyk spent 25 years as a survey and education statistician with the federal government, at the Census Bureau and the National Center for Education Statistics. She retired to Rock Hall.
Common Sense for the Eastern Shore


